
Estimate Any EV's Range From First Principles — A Free EV Performance Simulator
A free in-browser tool that simulates EV range, 0-60, and quarter-mile from first principles. Pick a vehicle, tweak the inputs, and watch range collapse on the highway, climb on backroads, and disappear entirely when the cabin heater is on and the car isn't moving.
Co-written with AI assistance from Claude Opus 4.7.


The Range Question Nobody Answers Honestly
Manufacturers publish a single range number. The EPA tests under one cycle. WLTP tests under another. Both are fine for comparison shopping; neither tells you what range you’ll actually get at 80 mph in cold weather with the heat on.
I built the EV Performance Simulator because the answer should be a calculation, not a guess. It runs the same physics EV engineers use: air drag, rolling resistance, drivetrain losses, motor efficiency, battery internal resistance, regenerative braking. The wizard turns your inputs into estimated range, 0-60, and quarter-mile times. Live, in your browser, with no install and no math required.
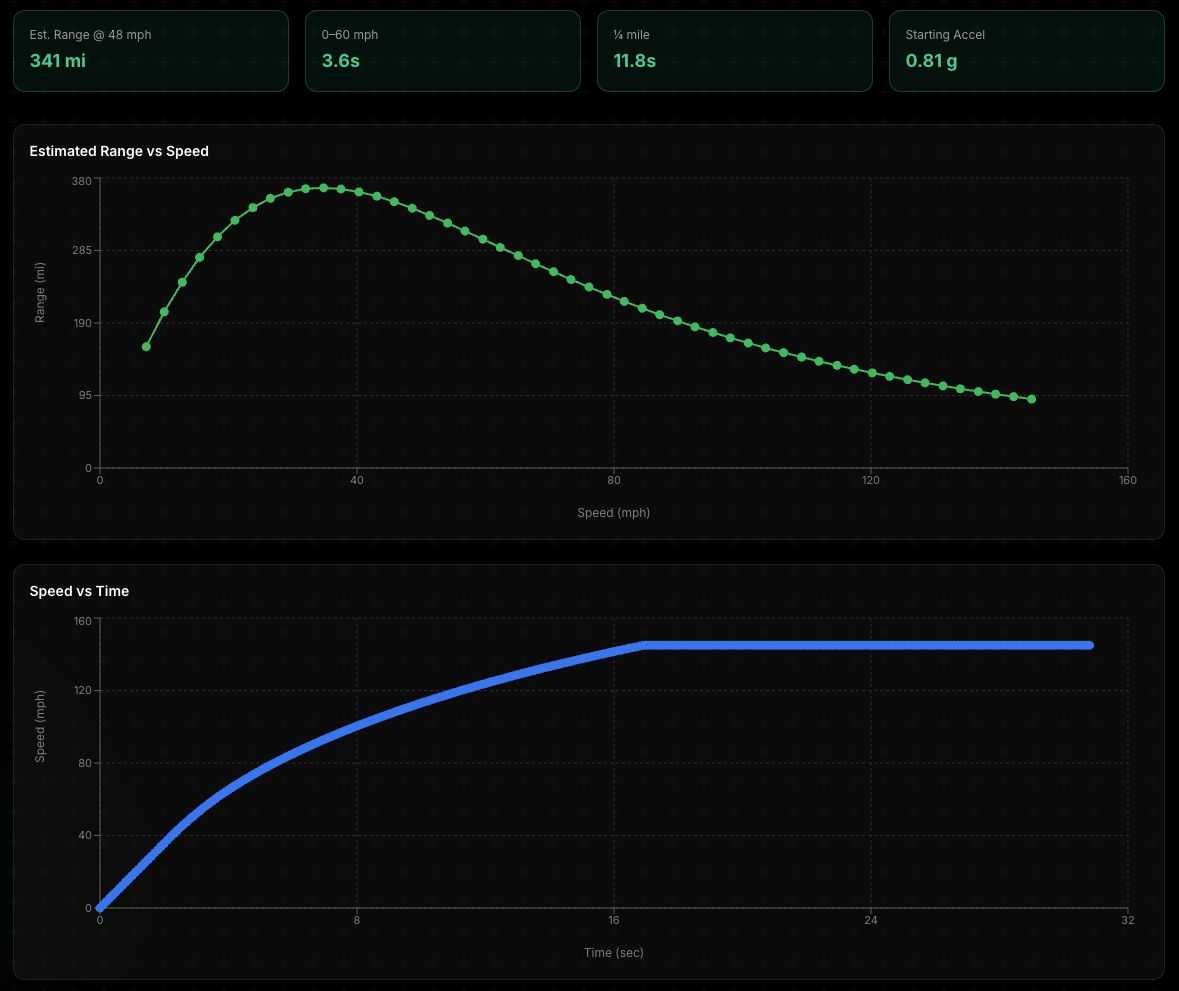
Results dashboard for a Tesla Model 3 LR. The range-vs-speed curve (left) bends down at high speed (drag) and at very low speed (auxiliary loads). The rest of this post explains why.
Why Range Isn’t a Single Number
Range is a function of several things that pull against each other. Understanding the trade-offs makes the marketing numbers a lot less mysterious.
Air drag scales with the square of speed
This is the single biggest factor at highway speed. Aerodynamic drag force is F = ½ × ρ × Cd × A × v². Double the speed, four times the drag. The reason Tesla, Lucid, and Mercedes spend so much design effort getting drag coefficient (Cd) down to ~0.22 is that every percentage point matters when you’re cruising at 75 mph.
A Tesla Model 3 RWD with Cd ≈ 0.22 and a 2.65 m² frontal area spends roughly 11 kW just pushing air at 70 mph. Bump that to 80 mph and air drag alone climbs past 16 kW, about a 50% jump for a 14% speed increase. Add rolling resistance, drivetrain losses, and aux loads on top, and total battery draw goes from ~15 kW at 65 mph to ~23 kW at 80 mph. Same battery, same car. You just spent a meaningful fraction of your highway range on the difference between cruise control settings.
Rolling resistance dominates at low speed
Rolling resistance force is roughly constant with speed: F = Crr × m × g. For a Model 3 on low-rolling-resistance EV tires (Crr ≈ 0.008), that’s about 150 N, independent of how fast you’re going. The power it costs you scales linearly with speed (P = F × v): roughly 2 kW at 30 mph, 4 kW at 70 mph. Aero drag power scales with speed cubed, so at low speed rolling resistance dominates the energy budget and at highway speed drag does. It’s why low-speed test cycles produce inflated range numbers. China’s CLTC averages 18 mph, where rolling losses dominate but aerodynamic losses are tiny. EPA highway runs at 48.3 mph, where the aero penalty kicks in. The same car can show 30%+ different range numbers between the two cycles, on the same battery.
Auxiliary loads drain you whether or not you’re moving
This is the one that breaks people’s intuition. HVAC, infotainment, the 12V system, battery thermal management. They all run continuously. A driving EV pulls 1.5-3 kW of auxiliary load on average. In cold weather with cabin heat, that can climb past 5 kW.
Here’s the kicker: those loads don’t care if the car is moving. Park a Tesla Model 3 with the cabin climate running and a 60 kWh pack will drain in roughly a day or two, depending on weather. Most of that energy goes to nothing but heating or cooling air around someone who isn’t even there. Drive the same car at 30 mph and the 2.5 kW aux load eats more energy per mile than actually moving the car does. Drive it at 80 mph and aux load becomes a footnote next to the 16 kW you’re spending on air drag.
That’s why range curves bend. At low speed, aux loads dominate. At high speed, drag dominates. Somewhere in the middle is the efficiency sweet spot for any given vehicle, the peak of the curve in the chart at the top of this post.
Regen recovers some, but only some
Regenerative braking recovers some of the energy you’d otherwise lose to friction brakes, but the amount depends almost entirely on how often you’re actually braking: roughly 5% of total drive energy at constant highway cruise, around 12% in mixed driving, and 15-20% in stop-and-go urban traffic. Big deal in the city, much smaller deal on the interstate where you barely brake. The simulator lets you enter your expected regen percentage on the Driving Conditions step, or pick a scenario preset that sets it for you.
How to Use the Simulator
Two paths, depending on how deep you want to go:
Quick path: Pick a vehicle on the second step (the wizard ships with presets for Tesla Model 3, Model Y, generic sedan, pickup, and a handful more) and every relevant field downstream auto-fills. Change average speed, climb grade, or auxiliary loads, and watch the live preview panel update in real time on the right side of the wizard. Total time from landing on the page to a useful range estimate: under a minute.
Engineering path: On the first step, enable Motor Performance and Climb Performance. Enter your motor specs: rated power, peak torque percentage, base speed, power factor, voltage. The tool computes 0-60 (or 0-100 km/h on metric), quarter mile (or standing 400 m), grade-climb performance, and a full motor torque-speed curve from scratch. Useful if you’re designing or evaluating a real vehicle and need numbers you can defend.
Match the driving scenario. Whichever path you take, the Driving Conditions step has a scenario selector that bundles average speed, regen, and auxiliary loads into common driving patterns: Highway cruise (48 mph), EPA combined estimate, Highway 65 mph, and Cold winter highway. Pick one and the live preview snaps to that pattern. The EPA-combined preset is calibrated to land within ~3% of advertised EPA range for the major Tesla configs, so if you want an EPA-comparable answer, pick the vehicle, switch to the EPA scenario, and you’re done. Toggle between scenarios to see how the same battery and chassis can swing 80-100 miles of range depending only on how the car is driven.
The live preview panel updates as you change anything. No “recalculate” button, no waiting. Sit on the Aerodynamics step, change the drag coefficient from 0.22 to 0.40, and watch range collapse by roughly a quarter in the panel on the right.
Once you’re done, the results page gives you a full performance dashboard: range vs. speed, speed vs. time, motor torque/power curves, resistive forces breakdown, climb performance, and a complete top-speed analysis.
If you’re a casual driver who just wants to know “what’s my range?”, you don’t need to give me anything. The headline numbers (range, 0-60, ¼-mile) show up live in the preview panel as you go, and the range-vs-speed and speed-vs-time charts unlock on the results page without an email. The deeper engineering analysis unlocks when you give me an email, so I can see who’s using the tool and reach out if your project looks like a fit.
Who It’s For
The math is the same whether you’re:
- An EV owner curious why your road-trip range never matches the sticker
- A fleet planner sizing trucks for a route with elevation
- An engineer debugging a powertrain that isn’t hitting expected range
- A student or hobbyist building intuition for vehicle dynamics
- A startup pitching investors and needing defensible performance numbers before the prototype exists
Everything in the tool is free. The detail behind the gate is so I know who’s using it, and so I can follow up if your use case looks like something I could help with.
Why I Built It
I wrote the control software for the ACIM traction inverter, the AC power supply, and the brake chopper on an Electric Semi Truck project, before the Tesla Semi was announced. The customer was hoping for 500 miles per charge, based on advice they’d received from engineers at other companies. We ran the numbers from first principles: drag, frontal area, rolling resistance, battery capacity, drivetrain losses. The estimate came back at 85 miles. The first real-world trial got about 80.
The gap was almost entirely two things: drag coefficient and rolling resistance. A typical Class 8 tractor-trailer pushes a wall of air through ~10 m² of frontal area at Cd ≈ 0.6-0.9, on tires that are nowhere near low-rolling-resistance EV tires. There’s no battery you can put in a truck like that that gets it to 500 miles at highway speeds. The math is brutal, and it doesn’t care what spec sheet you’d like to believe.
What Tesla showed with the Semi a few years later is what’s possible when you redesign the platform for those constraints from the ground up. Tesla claims a Cd of about 0.36, roughly half of a typical Class 8, by sculpting the cab to slip through the air rather than punch through it. They also use a multi-motor drivetrain where motors can be disengaged at low load, so highway cruising runs on a single motor instead of dragging two or three through the gear train as parasitic loss. That’s the kind of clean-sheet engineering that moves long-haul Class 8 range from “physically impossible” to “honestly difficult.” Most retrofit programs don’t get to make those changes, and the math reverts to the brutal version.
Most of us aren’t designing Class 8 trucks. But the same physics that caught that program off guard catches everyday EV owners by surprise too. I’ve watched the same questions roll through EV forums for years: “Why is my range so much lower than the EPA number?” “Why does my range tank in winter?” “Why did the car drain overnight?” The answers are always the same equations, and most people asking shouldn’t need a powertrain engineering background to get to them. The simulator started as an engineering spreadsheet a coworker and I put together for the Semi project. This release is a substantial rebuild on that foundation: vehicle presets, sensible defaults, a scenario picker, and a wizard friendly enough that anyone curious about their car can plug in numbers and see what falls out.
I’ll be honest about the other reason I’m putting this out: I want customers, exposure, and maybe a little street cred. If you’re designing a powertrain, sizing a battery, evaluating a vendor’s range claim, or trying to figure out why your prototype isn’t hitting spec, now you know I exist.
Try It
Open the EV Performance Simulator →
Try this: pick the Tesla Model Y LR AWD (2017-2023) preset. Click through the wizard. The live preview reports ~308 miles at the default 48.3 mph average, within a few percent of the published EPA combined of 326.
Now drop the average speed to 10 mph. Range falls to ~223 miles. Slower should be more efficient, and it is, until auxiliary loads (HVAC, infotainment, thermal management) start eating more energy than actually moving the car does. Below ~30 mph, aux loads win.
Bump it up to 80 mph. Range falls to ~190 miles. That’s the air-drag tax.
Same battery, same car, three very different ranges. The peak sits somewhere in the middle, the bend you saw in the chart at the top of this post.
Continue on to the performance results and you can see this displayed in the Estimated Range vs Speed chart. Mouse-over the curve to see the range and speed at particular points.
Additionally, go back to the Vehicle Basics step and adjust the payload to see how hauling heavy weight affects the range.
A note on EPA numbers. The simulator estimates range at a constant cruise at whatever average speed you set. EPA’s published range comes from a 5-cycle test that includes city stops, highway accelerations, HVAC loads, and cold-soak conditions, none of which a constant-speed simulator can fully capture. To get the closest EPA-comparable answer, pick the EPA combined estimate scenario on the Driving Conditions step: it lands within ~3% of advertised EPA range for the major Tesla presets. Treat any output as a physics-based estimate, not a substitute for an EPA test cycle. Real-world range varies with weather, terrain, traffic, payload, and HVAC use.
If you want help applying this kind of analysis to a real EV project (design, validation, embedded software, motor control, battery sizing), let’s talk.
